When NATL was established in 1994, none of it had burned in more than 50 years. As a result, there were no young longleaf pines in the more than 15 acres dominated by mature longleaf pines. NATL's planning and management committee (NAAC) designated 13 of these acres to be restored to a healthy upland pine ecosystem. Restoration started in 1995 in NATL's public area and soon expanded to include similar habitat in NATL's restricted area. As restoration progressed, mature longleafs died and initially no record was made of their loss or its causes. In some cases the cause seemed clear (blown down, struck by lightning, too much duff burned around base) but in many cases it did not. For example, in September 2004, winds from hurricanes Francis and Jeanne felled only two longleaf pines in the resticted area, but in 2006, after a severely dry spring, several times that many died. Most of these were in Block D and the western portion of Block C. This mortality is believed to have been from mechanical damage to the roots during wind-induced motion of the trunks in the September 2004 hurricanes.
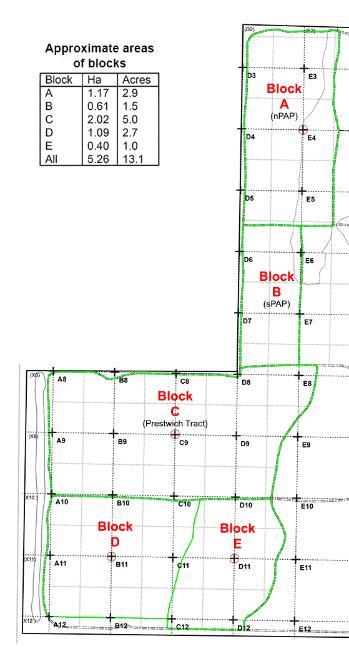
The 10 most useful maps of the five blocks of NATL's Upland Pine ecosystem are made easily accessible below. Every map displays NATL's 50x50 grid system, and each 50x50 gridblock is divided into four 25x25 "1/4-gridblocks." (On the ground, the corners of all gridblocks are marked with stakes.) Five of the 10 maps are "diameter maps." These show the positions of all pines in the block that are 10cm or more in diameter at breast-height [DBH]. For each pine mapped, the diameter, species, and condition (live or snag), are made evident. The other five of the most useful maps are "P-number" maps. These give access to important data for any mapped NATL pine in a GIS-Based Spreadsheet. The geographic coordinates of all 50x50m grid stakes are in a second online spreadsheet. Both these and the calculated coordinates for the 25x25m grid stakes are in NATL's GIS
Ten most useful maps
The PDF files of the ten maps may be downloaded by clicking the appropriate cell in the table below. The diameter maps can be viewed and printed by clicking on the appropriate UP block in the map at left.
As already explained above, P-number maps provide a unique identifier for each pine tree to allow access to important data for any mapped NATL pine in this GIS-based spreadsheet.
Additional maps of UP blocks
All blocks with gridlines
Base map of A and B (with pines and diameters)
Base map of A and B (no pines or diameters)
Outline map of Block C
Outline map of Blocks D and E
Restoration islands (Blocks A & B, 2005)
These 48 small areas (“islands”) were given special treatment during the early years of restoring Blocks A & B. The effects of the special treatment of these islands are still quite evident.
Pine map archive
As the maps of NATL pines are updated, earlier versions are moved to a map archive. This will facilitate following the life histories of all the trees from the year of first mapping to the crashing of its snag. For the time being the archive will have only the 2008 maps of blocks and sub-blocks of Upland Pine ecosystem. A way to begin is to make all the maps originally accessible at what you moved in part to “Earlier Maps of Pines in NATL’s Upland Pine Ecosystem.”