
Plants
Below are documents containing the complete plant inventory of identified species found in NATL. This document is updated periodically to maintain accuracy. The most recent updated was made in December 2024.
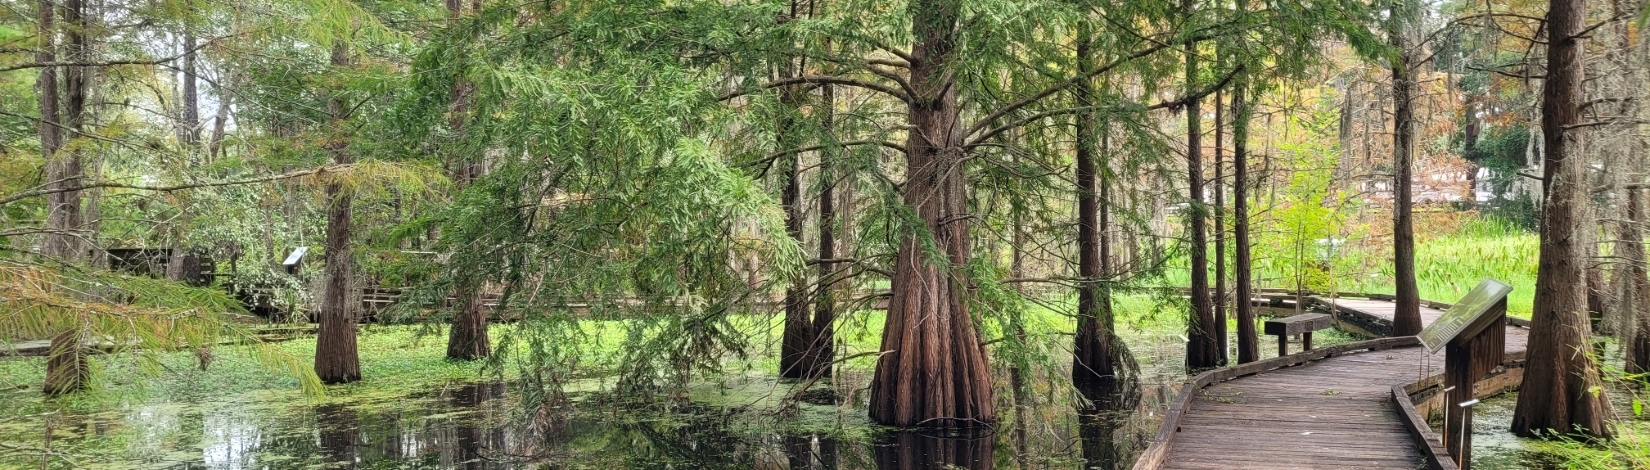
NATL is home to more than 560 species of vascular plants. Species are listed alphabetically by scientific name within the documents. If you don't know the scientific name of a plant of interest, you can search for it by its common name. However, be forewarned that many species have multiple common names and the ones that are less frequently used may not be in our indexes.
Plant Community Monitoring
Plant community monitoring is extremely important because it can guide our decision-making concerning the impact our management actions have on certain communities. A prime area of concern is the upland pine community, where active restoration with considerable resources is being spent. Over time, monitoring data may help inform future management decisions and provide real data for potential research projects.
In 2018 members of the NATL operations committee, along with volunteers, helped establish a set of long-term monitoring plots. The plots established are 10m2 and feature five nested quadrats of sizes (0.01m2, 0.1m2, 1m2, 3.16m2, 10m2) that extend outwards beginning from the NE plot corner. A total of 10 plots were established at NATL's upland pine area. Plots were established with donated scrap metal poles, marked with GPS, and photographed annually from the south plot border facing north. In each plot, species presence was recorded only once as they occurred in each nested quadrat. Coverage for each species was measured at the 10m2 level. This data is available upon request for any students who would like to perform research in NATL.